Bokeh - 添加小部件
bokeh.models.widgets 模块包含类似于 HTML 表单元素的 GUI 对象的定义,例如按钮、滑块、复选框、单选按钮等。这些控件为绘图提供交互式界面。 可以通过在相应事件上执行的自定义 JavaScript 函数来执行修改绘图数据、更改绘图参数等调用处理。
Bokeh 允许使用两种方法定义回调功能 −
使用 CustomJS 回调,以便交互将在独立的 HTML 文档中工作。
使用 Bokeh 服务器 并设置事件处理程序。
在本节中,我们将了解如何添加 Bokeh 小部件和分配 JavaScript 回调。
Button 按钮小部件
这个小部件是一个可点击的按钮,通常用于调用用户定义的回调处理程序。 构造函数采用以下参数 −
Button(label, icon, callback)
label 参数是用作按钮标题的字符串,callback 是单击时调用的自定义 JavaScript 函数。
在以下示例中,绘图和按钮小部件显示在列布局中。 该图本身呈现了 x 和 y 数据系列之间的线形符号。
已使用 CutomJS() 函数 定义了名为"callback"的自定义 JavaScript 函数。 它在表单变量 cb_obj 中接收对触发回调的对象(在本例中为按钮)的引用。
此函数更改源 ColumnDataSource 数据并最终在源数据中发出此更新。
from bokeh.layouts import column
from bokeh.models import CustomJS, ColumnDataSource
from bokeh.plotting import Figure, output_file, show
from bokeh.models.widgets import Button

x = [x*0.05 for x in range(0, 200)]
y = x

source = ColumnDataSource(data=dict(x=x, y=y))
plot = Figure(plot_width=400, plot_height=400)
plot.line('x', 'y', source=source, line_width=3, line_alpha=0.6)

callback = CustomJS(args=dict(source=source), code="""
   var data = source.data;
   x = data['x']
   y = data['y']
   for (i = 0; i < x.length; i++) {
      y[i] = Math.pow(x[i], 4)
   }
   source.change.emit();
""")

btn = Button(label="click here", callback=callback, name="1")

layout = column(btn , plot)
show(layout)
输出(初始)
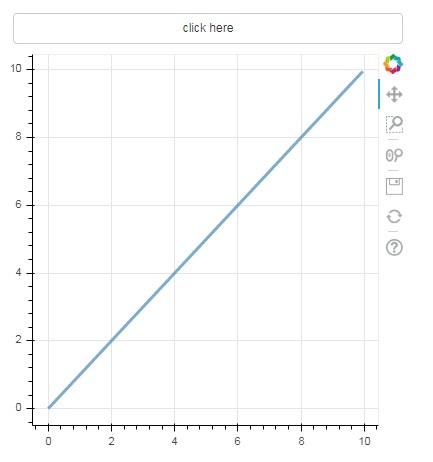
点击绘图顶部的按钮,查看更新后的绘图,如下所示 −
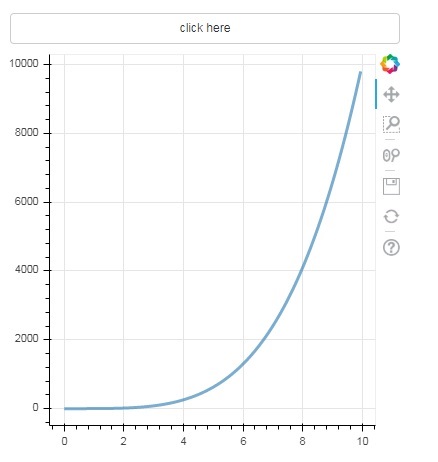
输出(点击后)
Slider 滑块小部件
借助滑块控件,可以在分配给它的开始和结束属性之间选择一个数字。
Slider(start, end, step, value)
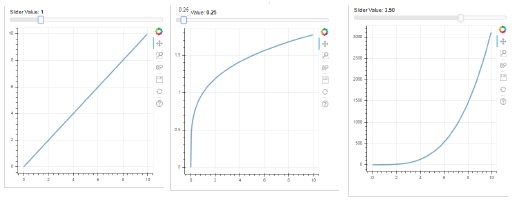
在下面的例子中,我们在滑块的 on_change 事件上注册了一个回调函数。 滑块的瞬时数值以 cb_obj.value 的形式提供给处理程序,用于修改 ColumnDatasource 数据。 当您滑动位置时,绘图会不断更新。
from bokeh.layouts import column
from bokeh.models import CustomJS, ColumnDataSource
from bokeh.plotting import Figure, output_file, show
from bokeh.models.widgets import Slider

x = [x*0.05 for x in range(0, 200)]
y = x

source = ColumnDataSource(data=dict(x=x, y=y))
plot = Figure(plot_width=400, plot_height=400)
plot.line('x', 'y', source=source, line_width=3, line_alpha=0.6)

handler = CustomJS(args=dict(source=source), code="""
   var data = source.data;
   var f = cb_obj.value
   var x = data['x']
   var y = data['y']
   for (var i = 0; i < x.length; i++) {
      y[i] = Math.pow(x[i], f)
   }
   source.change.emit();
""")

slider = Slider(start=0.0, end=5, value=1, step=.25, title="Slider Value")

slider.js_on_change('value', handler)
layout = column(slider, plot)
show(layout)
输出
RadioGroup
这个小部件提供了一组相互排斥的切换按钮,在标题的左侧显示圆形按钮。
RadioGroup(labels, active)
其中,labels 是标题列表,active 是所选选项的索引。
Select 下拉列表小部件
这个小部件是一个简单的字符串项下拉列表,可以选择其中一个。 所选字符串出现在顶部窗口,它是值参数。
Select(options, value)
下拉列表中的字符串元素列表以选项列表对象的形式给出。
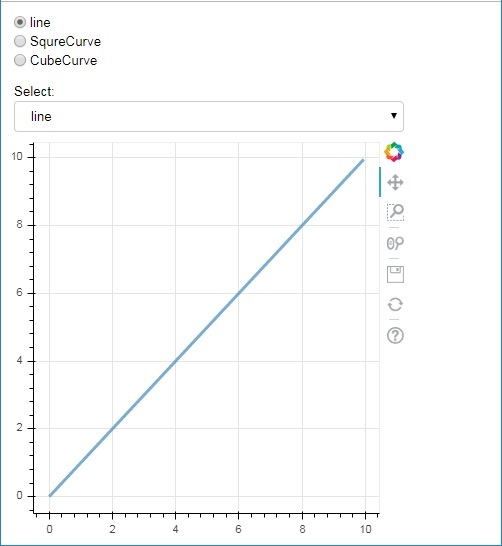
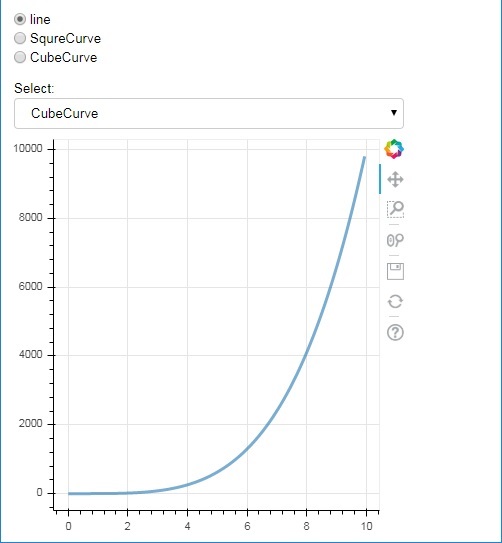
以下是单选按钮和选择小部件的组合示例,它们都提供了 x 和 y 数据系列之间的三种不同关系。 RadioGroup 和Select 小部件 通过 on_change() 方法注册到相应的处理程序。
from bokeh.layouts import column
from bokeh.models import CustomJS, ColumnDataSource
from bokeh.plotting import Figure, output_file, show
from bokeh.models.widgets import RadioGroup, Select

x = [x*0.05 for x in range(0, 200)]
y = x

source = ColumnDataSource(data=dict(x=x, y=y))

plot = Figure(plot_width=400, plot_height=400)
plot.line('x', 'y', source=source, line_width=3, line_alpha=0.6)

radiohandler = CustomJS(args=dict(source=source), code="""
   var data = source.data;
   console.log('Tap event occurred at x-position: ' + cb_obj.active);
   //plot.title.text=cb_obj.value;
   x = data['x']
   y = data['y']
   if (cb_obj.active==0){
      for (i = 0; i < x.length; i++) {
         y[i] = x[i];
      }
   }
   if (cb_obj.active==1){
      for (i = 0; i < x.length; i++) {
         y[i] = Math.pow(x[i], 2)
      }
   }
   if (cb_obj.active==2){
      for (i = 0; i < x.length; i++) {
         y[i] = Math.pow(x[i], 4)
      }
   }
   source.change.emit();
""")

selecthandler = CustomJS(args=dict(source=source), code="""
   var data = source.data;
   console.log('Tap event occurred at x-position: ' + cb_obj.value);
   //plot.title.text=cb_obj.value;
   x = data['x']
   y = data['y']
   if (cb_obj.value=="line"){
      for (i = 0; i < x.length; i++) {
         y[i] = x[i];
      }
   }
   if (cb_obj.value=="SquareCurve"){
      for (i = 0; i < x.length; i++) {
         y[i] = Math.pow(x[i], 2)
      }
   }
   if (cb_obj.value=="CubeCurve"){
      for (i = 0; i < x.length; i++) {
         y[i] = Math.pow(x[i], 4)
      }
   }
   source.change.emit();
""")

radio = RadioGroup(
   labels=["line", "SqureCurve", "CubeCurve"], active=0)
radio.js_on_change('active', radiohandler)
select = Select(title="Select:", value='line', options=["line", "SquareCurve", "CubeCurve"])
select.js_on_change('value', selecthandler)

layout = column(radio, select, plot)
show(layout)
输出
Tab 选项卡小部件
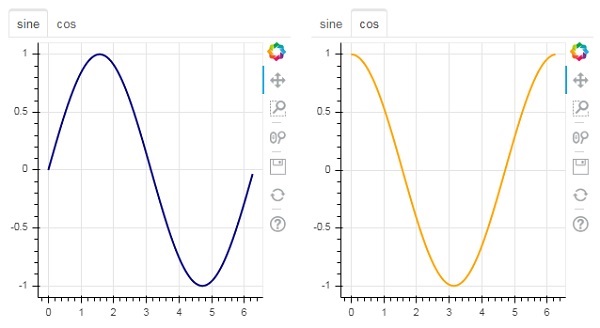
就像在浏览器中一样,每个选项卡可以显示不同的网页,Tab 小部件是散景模型,为每个图形提供不同的视图。 在下面的示例中,正弦和余弦曲线的两个绘图图形呈现在两个不同的选项卡中 −
from bokeh.plotting import figure, output_file, show
from bokeh.models import Panel, Tabs
import numpy as np
import math
x=np.arange(0, math.pi*2, 0.05)
fig1=figure(plot_width=300, plot_height=300)

fig1.line(x, np.sin(x),line_width=2, line_color='navy')

tab1 = Panel(child=fig1, title="sine")
fig2=figure(plot_width=300, plot_height=300)
fig2.line(x,np.cos(x), line_width=2, line_color='orange')
tab2 = Panel(child=fig2, title="cos")

tabs = Tabs(tabs=[ tab1, tab2 ])

show(tabs)
输出