Bokeh - 使用入门
创建两个 numpy 数组之间的简单线图非常简单。 首先,从 bokeh.plotting 模块导入以下函数 −
from bokeh.plotting import figure, output_file, show
figure() 函数创建一个新的绘图图形。
output_file() 函数用于指定一个 HTML 文件来存储输出。
show() 函数在浏览器中显示 Bokeh 图。
接下来,设置两个 numpy 数组,其中第二个数组是第一个数组的正弦值。
import numpy as np
import math
x = np.arange(0, math.pi*2, 0.05)
y = np.sin(x)
要获取 Bokeh 图对象,请指定标题以及 x 和 y 轴标签,如下所示 −
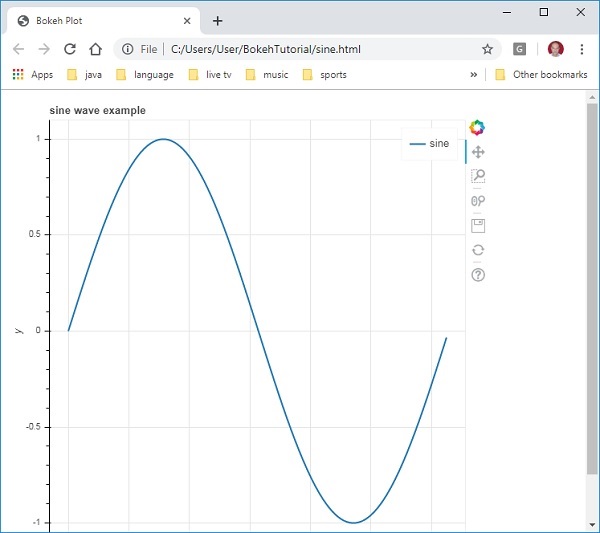
p = figure(title = "sine wave example", x_axis_label = 'x', y_axis_label = 'y')
Figure 对象包含一个 line() 方法,它向图中添加一个线条字形。 它需要 x 和 y 轴的数据系列。
p.line(x, y, legend = "sine", line_width = 2)
最后,设置输出文件并调用 show() 函数。
output_file("sine.html")
show(p)
这将在"sine.html"中呈现线图并将显示在浏览器中。
完整代码及其输出如下
from bokeh.plotting import figure, output_file, show
import numpy as np
import math
x = np.arange(0, math.pi*2, 0.05)
y = np.sin(x)
output_file("sine.html")
p = figure(title = "sine wave example", x_axis_label = 'x', y_axis_label = 'y')
p.line(x, y, legend = "sine", line_width = 2)
show(p)
浏览器输出