Bokeh - 布局
Bokeh 可视化可以适当地安排在不同的布局选项中。 这些布局和大小调整模式会导致绘图和小部件根据浏览器窗口的大小自动调整大小。 为了保持一致的外观,布局中的所有项目必须具有相同的调整大小模式。 小部件(按钮、菜单等)保存在单独的小部件框中,而不是绘图图中。
第一种布局是列布局,它垂直显示图表。 column() 函数 在 bokeh.layouts 模块中定义并采用以下签名 −
from bokeh.layouts import column
col = column(children, sizing_mode)
children − 绘图和/或小部件列表。
sizing_mode − 确定布局中的项目如何调整大小。 可能的值是"fixed"、"stretch_both"、"scale_width"、"scale_height"、"scale_both"。 默认为"fixed"。
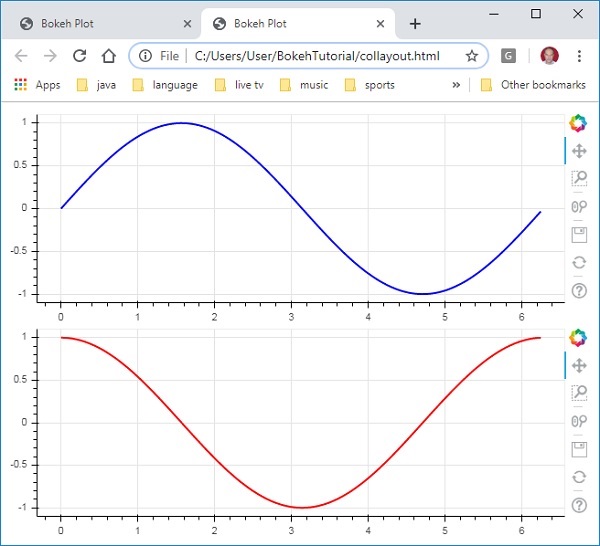
以下代码生成两个 Bokeh 图像并将它们放置在列布局中,以便它们垂直显示。 每个图中都显示了表示 x 和 y 数据系列之间正弦和余弦关系的线形符号。
from bokeh.plotting import figure, output_file, show
from bokeh.layouts import column
import numpy as np
import math
x = np.arange(0, math.pi*2, 0.05)
y1 = np.sin(x)
y2 = np.cos(x)
fig1 = figure(plot_width = 200, plot_height = 200)
fig1.line(x, y1,line_width = 2, line_color = 'blue')
fig2 = figure(plot_width = 200, plot_height = 200)
fig2.line(x, y2,line_width = 2, line_color = 'red')
c = column(children = [fig1, fig2], sizing_mode = 'stretch_both')
show(c)
输出
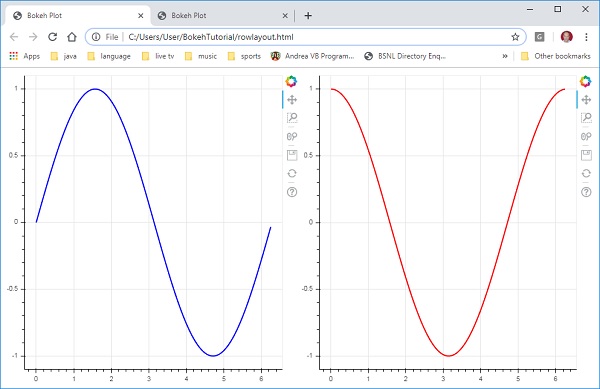
类似地,Row layout 水平排列图,为此使用 bokeh.layouts 模块中定义的 row() 函数。 正如您所想,它也有两个参数(类似于 column() 函数)——children 和 sizing_mode。
上图中垂直显示的正弦和余弦曲线现在在行布局中水平显示,代码如下
from bokeh.plotting import figure, output_file, show
from bokeh.layouts import row
import numpy as np
import math
x = np.arange(0, math.pi*2, 0.05)
y1 = np.sin(x)
y2 = np.cos(x)
fig1 = figure(plot_width = 200, plot_height = 200)
fig1.line(x, y1,line_width = 2, line_color = 'blue')
fig2 = figure(plot_width = 200, plot_height = 200)
fig2.line(x, y2,line_width = 2, line_color = 'red')
r = row(children = [fig1, fig2], sizing_mode = 'stretch_both')
show(r)
输出
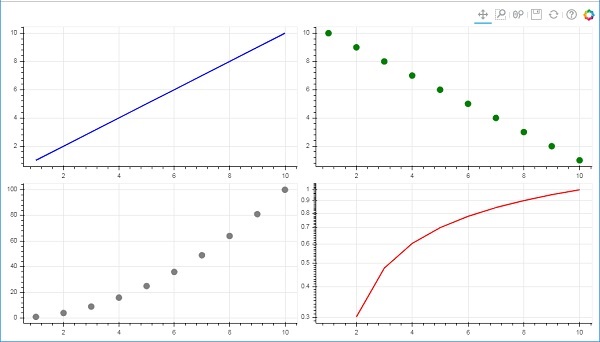
Bokeh 包还具有网格布局。 它在行和列的二维网格中包含多个绘图图形(以及小部件)。 bokeh.layouts 模块中的 gridplot() 函数 返回一个网格和一个统一的工具栏,可以在 toolbar_location 属性的帮助下定位。
这与行或列布局不同,行或列布局中每个图都显示自己的工具栏。 grid() 函数也使用 children 和 sizing_mode 参数,其中 children 是列表的列表。 确保每个子列表具有相同的维度。
在下面的代码中,x 和 y 数据系列之间的四种不同关系被绘制在一个两行两列的网格中。
from bokeh.plotting import figure, output_file, show
from bokeh.layouts import gridplot
import math
x = list(range(1,11))

y1 = x
y2 =[11-i for i in x]
y3 = [i*i for i in x]
y4 = [math.log10(i) for i in x]

fig1 = figure(plot_width = 200, plot_height = 200)
fig1.line(x, y1,line_width = 2, line_color = 'blue')
fig2 = figure(plot_width = 200, plot_height = 200)
fig2.circle(x, y2,size = 10, color = 'green')
fig3 = figure(plot_width = 200, plot_height = 200)
fig3.circle(x,y3, size = 10, color = 'grey')
fig4 = figure(plot_width = 200, plot_height = 200, y_axis_type = 'log')
fig4.line(x,y4, line_width = 2, line_color = 'red')
grid = gridplot(children = [[fig1, fig2], [fig3,fig4]], sizing_mode = 'stretch_both')
show(grid)
输出