Seaborn.set_color_codes() 方法
Seaborn.set_color_codes() 方法用于更改 matplotlib 颜色速记的解释方式。 调用它会改变 matplotlib 在下一个图中解释像"b"或"g"这样的速记代码的方式。
matplotlib 颜色简写不过是我们用来表示颜色的快捷方式。 例如,单字符简写用于表示基本颜色,如蓝色('b')、绿色('g')、红色('r')、黄色('y')等。
语法
以下是 seaborn.set_color_codes() 方法的语法 −
seaborn.set_color_codes(palette='deep')
参数
该参数有一个参数,下面进行说明。
| S.No | 参数及说明 |
|---|---|
| 1 | palette 采用值 {deep, muted, pastel, dark, bright, colorblind} 并用于命名 seaborn 调色板以用作颜色源。 |
在进入示例之前,我们将了解如何从 seaborn 库加载数据集。
载入seaborn 库
要加载或导入 seaborn 库,可以使用以下代码行。
Import seaborn as sns
加载数据集
在本文中,我们将使用 seaborn 库中内置的 Tips 数据集。 以下命令用于加载数据集。
tips=sns.load_dataset("tips")
下面提到的命令用于查看数据集中的前 5 行。 这使我们能够了解哪些变量可用于绘制图形。
tips.head()
以下是上面这段代码的输出。
index,total_bill,tip,sex,smoker,day,time,size
0,16.99,1.01,Female,No,Sun,Dinner,2
1,10.34,1.66,Male,No,Sun,Dinner,3
2,21.01,3.5,Male,No,Sun,Dinner,3
3,23.68,3.31,Male,No,Sun,Dinner,2
4,24.59,3.61,Female,No,Sun,Dinner,4
既然我们已经加载了数据,我们将继续了解该方法在以下示例中的工作原理。
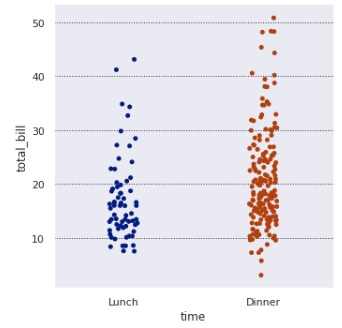
示例 1
在这个例子中,我们将看到如何使用 seaborn 的 set_color_codes() 方法并向它传递一个参数。 稍后我们将绘制图表以使用设置的颜色代码。 我们在此示例中使用提示数据集,并在设置颜色代码后绘制分类图。
import seaborn as sns
import matplotlib.pyplot as plt
tips=sns.load_dataset("tips")
tips.head()
sns.set_color_codes("dark")
sns.catplot(data=tips,x="time",y="total_bill")
plt.show()
输出
The output produced is seen below,
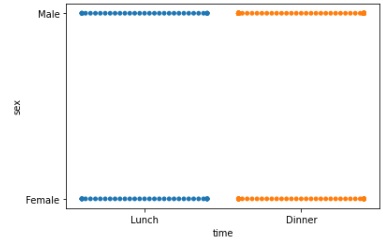
示例 2
我们将另一个值传递给 set_color_codes() 方法并查看图形如何变化。 在这里,"dark"作为参数传递,稍后绘制图表以查看图表颜色代码如何变化。
import seaborn as sns
import matplotlib.pyplot as plt
tips=sns.load_dataset("tips")
tips.head()
sns.set_color_codes("dark")
sns.swarmplot(data=tips,x="time",y="sex")
plt.show()
输出
得到的输出如下 −
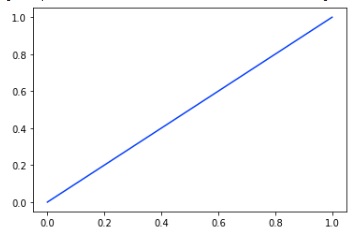
示例 3
我们使用 mathplotlib pyplot 方法绘制图形,而不是使用 seaborn 方法并传递数据集。 通过这种方式,我们可以理解 seaborn 方法适用于各种 plot 而不仅仅是 seaborn plots。 本例中颜色代码设置为明亮,获得的图附在下面。
import seaborn as sns
import matplotlib.pyplot as plt
tips=sns.load_dataset("tips")
tips.head()
sns.set_color_codes("bright")
plt.plot([0, 1], color="b")
plt.show()
输出
输出如下,
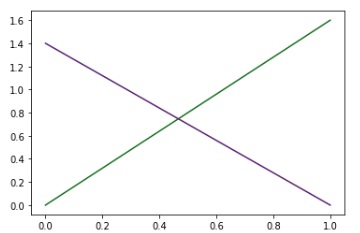
示例 4
在这种情况下,我们将颜色代码设置为深色,然后使用 matplotlib pyplot 方法绘制图形并将颜色设置为绿色和紫色。 为此要传递给颜色参数的变量是 g 表示绿色,m 表示紫色。
import seaborn as sns
import matplotlib.pyplot as plt
tips=sns.load_dataset("tips")
tips.head()
sns.set_color_codes("dark")
_ = plt.plot([0, 1.6], color="g")
_ = plt.plot([1.4, 0], color="m")
plt.show()
输出
得到的图如下,