Seaborn.set_style() 方法
Seaborn.set_style() 方法设置控制绘图的一般样式的参数。 此方法与 seaborn.axes_style() 方法紧密配合,因为它还会检查网格是否默认启用,并使用其样式参数控制各种属性,如背景颜色等。
设置这些参数以控制绘图的一般样式可以通过 matplotlib rcParams 系统来完成。
语法
以下是 seaborn.set_style() 方法的语法 −
seaborn.set_style(style=None, rc=None)
参数
seaborn.set_style()方法的参数如下 −
| S.No | 参数及说明 |
|---|---|
| 1 | Style 采用值、None、dict 或 {darkgrid, whitegrid, dark, white, ticks} 之一并确定参数字典或预配置样式的名称。 |
| 2 | Rc 以rcdict为值,是一个可选参数,执行参数映射以覆盖预设的seaborn样式字典中的值。 这只会更新被视为样式定义一部分的参数。 |
现在我们将继续了解该方法并在示例中使用它。
示例 1
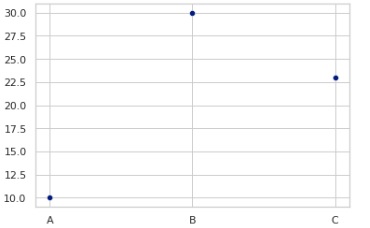
样式设置为 "whitegrid",并绘制带有值列表的散点图。 显示了获得的图。
import seaborn as sns
import matplotlib.pyplot as plt
tips=sns.load_dataset("tips")
tips.head()
sns.set_style("whitegrid")
sns.scatterplot(x=["A", "B", "C"], y=[10, 30, 23])
plt.show()
输出
曲线图如下 −
示例 2
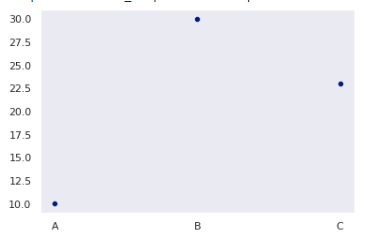
我们将在这个例子中看到另一种风格。 深色是可以设置的样式,得到的图如下图。
import seaborn as sns
import matplotlib.pyplot as plt
tips=sns.load_dataset("tips")
tips.head()
sns.set_style("dark")
sns.scatterplot(x=["A", "B", "C"], y=[10, 30, 23])
plt.show()
输出
得到的结果是,
示例 3
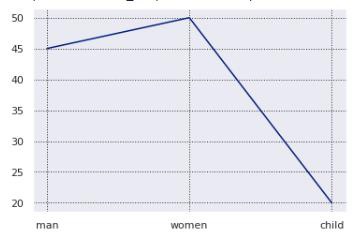
在这个例子中,我们将看到如何在设置样式时更改网格颜色和网格线样式。 您必须如下所示初始化它们,获得的图形将如图所示变化。
import seaborn as sns
import matplotlib.pyplot as plt
tips=sns.load_dataset("tips")
tips.head()
sns.set_style("darkgrid", {"grid.color": ".2", "grid.linestyle": ":"})
sns.lineplot(x=["man", "women", "child"], y=[45, 50, 20])
plt.show()
输出
得到的输出如下 −