Bokeh - 注释与图例
注释是添加到图表中的一些解释性文本。 Bokeh 图可以通过指定绘图标题、x 轴和 y 轴标签以及在绘图区域的任何位置插入文本标签来注释。
绘图标题以及 x 和 y 轴标签可以在 Figure 构造函数本身中提供。
fig = figure(title, x_axis_label, y_axis_label)
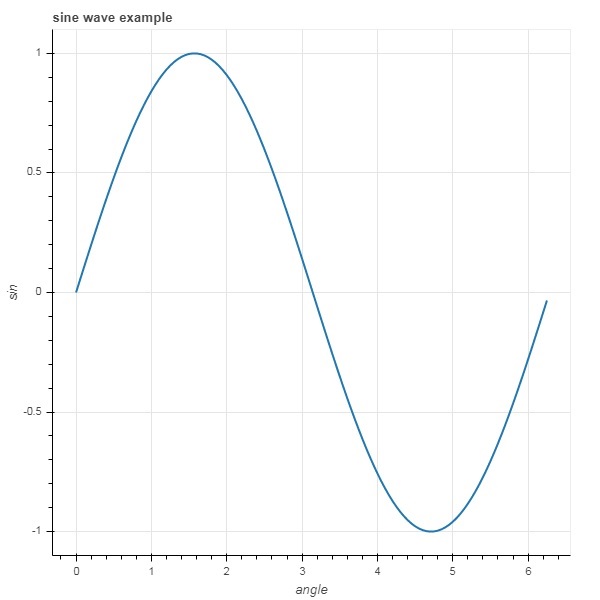
在下面的图中,这些属性的设置如下所示 −
from bokeh.plotting import figure, output_file, show
import numpy as np
import math
x = np.arange(0, math.pi*2, 0.05)
y = np.sin(x)
fig = figure(title = "sine wave example", x_axis_label = 'angle', y_axis_label = 'sin')
fig.line(x, y,line_width = 2)
show(p)
输出
标题的文本和轴标签也可以通过将适当的字符串值分配给图形对象的相应属性来指定。
fig.title.text = "sine wave example"
fig.xaxis.axis_label = 'angle'
fig.yaxis.axis_label = 'sin'
还可以指定标题的位置、对齐方式、字体和颜色。
fig.title.align = "right"
fig.title.text_color = "orange"
fig.title.text_font_size = "25px"
fig.title.background_fill_color = "blue"
为情节图添加图例非常容易。 我们必须使用任何字形方法的图例属性。
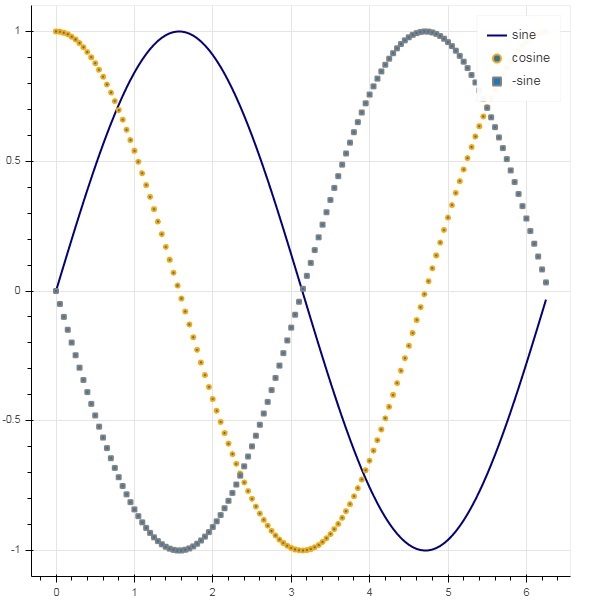
下面我们在图中有三个字形曲线,具有三个不同的图例 −
from bokeh.plotting import figure, output_file, show
import numpy as np
import math
x = np.arange(0, math.pi*2, 0.05)
fig = figure()
fig.line(x, np.sin(x),line_width = 2, line_color = 'navy', legend = 'sine')
fig.circle(x,np.cos(x), line_width = 2, line_color = 'orange', legend = 'cosine')
fig.square(x,-np.sin(x),line_width = 2, line_color = 'grey', legend = '-sine')
show(fig)
输出