Bokeh - 带有字形的绘图
任何绘图通常由一个或多个几何形状组成,例如线、圆、矩形等。这些形状具有关于相应数据集的视觉信息。 在 Bokeh 术语中,这些几何形状被称为字形。 使用 bokeh.plotting interface 构建的 Bokeh 图使用一组默认的工具和样式。 但是,可以使用可用的绘图工具自定义样式。
绘图类型
使用字形创建的不同类型的图如下所示 −
线图
这种类型的绘图对于以直线形式可视化点沿 x 轴和 y 轴的移动非常有用。 它用于执行时间序列分析。
条形图
这通常用于指示数据集中特定列或字段的每个类别的计数。
斑块图
此图表示具有特定颜色阴影的点区域。 这种类型的图用于区分同一数据集中的不同组。
散点图
这种类型的图用于可视化两个变量之间的关系,并指示它们之间的相关强度。
通过调用 Figure 类的适当方法形成不同的字形图。 Figure 对象是通过以下构造函数获得的 −
from bokeh.plotting import figure
figure(**kwargs)
可以通过各种关键字参数自定义 Figure 对象。
| Sr.No | 标题 | 设置绘图的标题 |
|---|---|---|
| 1 | x_axis_label | 设置x轴标题 |
| 2 | y_axis_label | 设置y轴标题 |
| 3 | plot_width | 设置图形宽度 |
| 4 | plot_height | 设置图形高度 |
线图
Figure 对象的 line() 方法 向 Bokeh 图形添加一个线条字形。 它需要 x 和 y 参数作为数据数组来显示它们的线性关系。
from bokeh.plotting import figure, show
fig = figure()
fig.line(x,y)
show(fig)
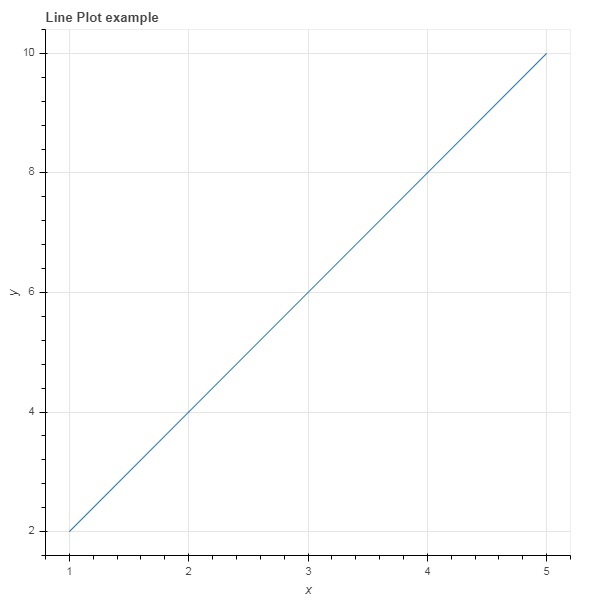
以下代码以 Python 列表对象的形式呈现两组值之间的简单线图 −
from bokeh.plotting import figure, output_file, show
x = [1,2,3,4,5]
y = [2,4,6,8,10]
output_file('line.html')
fig = figure(title = 'Line Plot example', x_axis_label = 'x', y_axis_label = 'y')
fig.line(x,y)
show(fig)
输出
条形图
图形对象有两种不同的构造条形图的方法
hbar()
条形图在绘图宽度上水平显示。 hbar() 方法 具有以下参数 −
| Sr.No | y | 水平条中心的 y 坐标。 |
|---|---|---|
| 1 | height | 垂直条的高度。 |
| 2 | right | 右边缘的 x 坐标。 |
| 3 | left | 左边缘的 x 坐标。 |
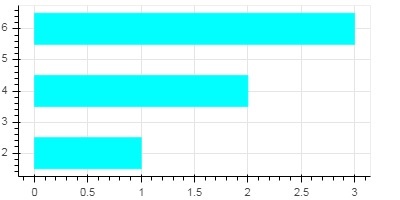
以下代码是使用 Bokeh 的水平条示例。
from bokeh.plotting import figure, output_file, show
fig = figure(plot_width = 400, plot_height = 200)
fig.hbar(y = [2,4,6], height = 1, left = 0, right = [1,2,3], color = "Cyan")
output_file('bar.html')
show(fig)
输出
vbar()
条形图垂直显示在绘图高度上。 vbar() 方法 具有以下参数 −
| Sr.No | x | 垂直条中心的 x 坐标。 |
|---|---|---|
| 1 | width | 垂直条的宽度。 |
| 2 | top | 顶部边缘的 y 坐标。 |
| 3 | bottom | 底部边缘的 y 坐标。 |
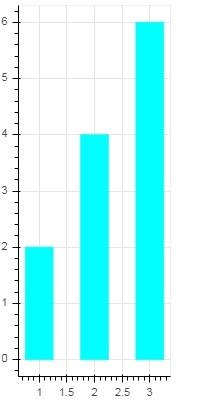
以下代码显示垂直条形图 −
from bokeh.plotting import figure, output_file, show
fig = figure(plot_width = 200, plot_height = 400)
fig.vbar(x = [1,2,3], width = 0.5, bottom = 0, top = [2,4,6], color = "Cyan")
output_file('bar.html')
show(fig)
输出
斑块图
以特定颜色为空间区域着色以显示具有相似属性的区域或组的图在 Bokeh 中称为补丁图。 Figure 对象具有用于此目的的 patch() 和 patches() 方法。
patch()
此方法将补丁字形添加到给定图形。 该方法具有以下参数 −
| 1 | x | 斑块点的 x 坐标。 |
| 2 | y | 斑块点的 y 坐标。 |
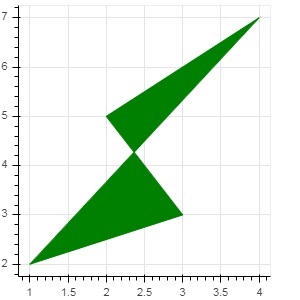
一个简单的斑块图是通过下面的Python代码得到的 −
from bokeh.plotting import figure, output_file, show
p = figure(plot_width = 300, plot_height = 300)
p.patch(x = [1, 3,2,4], y = [2,3,5,7], color = "green")
output_file('patch.html')
show(p)
输出
patches()
该方法用于绘制多个多边形面片。 它需要以下参数 −
| 1 | xs | 所有斑块的 x 坐标,以"列表的列表"形式给出。 |
| 2 | ys | 所有斑块的 y 坐标,以"列表列表"的形式给出。 |
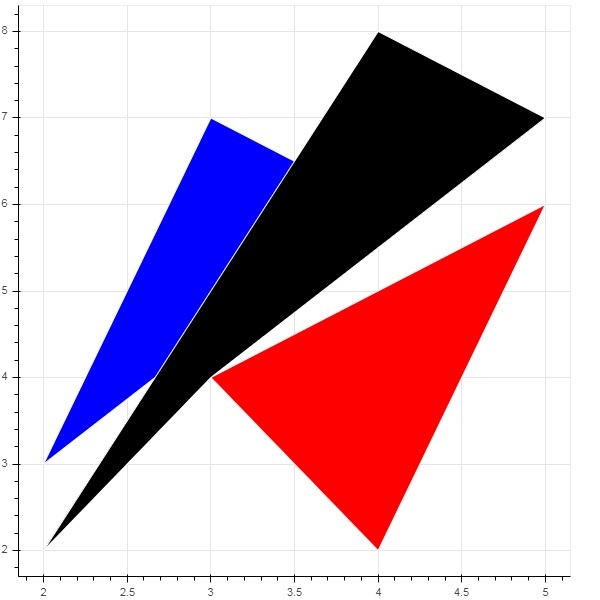
以 patches() 方法为例,运行以下代码 −
from bokeh.plotting import figure, output_file, show
xs = [[5,3,4], [2,4,3], [2,3,5,4]]
ys = [[6,4,2], [3,6,7], [2,4,7,8]]
fig = figure()
fig.patches(xs, ys, fill_color = ['red', 'blue', 'black'], line_color = 'white')
output_file('patch_plot.html')
show(fig)
输出
散点图
散点图非常常用于确定两个变量之间的双变量关系。 使用 Bokeh 将增强的交互性添加到它们中。 散点图是调用Figure对象的scatter()方法得到的。 它使用以下参数 −
| 1 | x | 中心x坐标的值或字段名 |
| 2 | y | 中心y坐标的值或字段名称 |
| 3 | size | 屏幕单位大小的值或字段名称 |
| 4 | marker | 标记类型的值或字段名 |
| 5 | color | 设置填充和线条颜色 |
在 Bokeh 中定义了以下标记类型常量: −
- Asterisk
- Circle
- CircleCross
- CircleX
- Cross
- Dash
- Diamond
- DiamondCross
- Hex
- InvertedTriangle
- Square
- SquareCross
- SquareX
- Triangle
- X
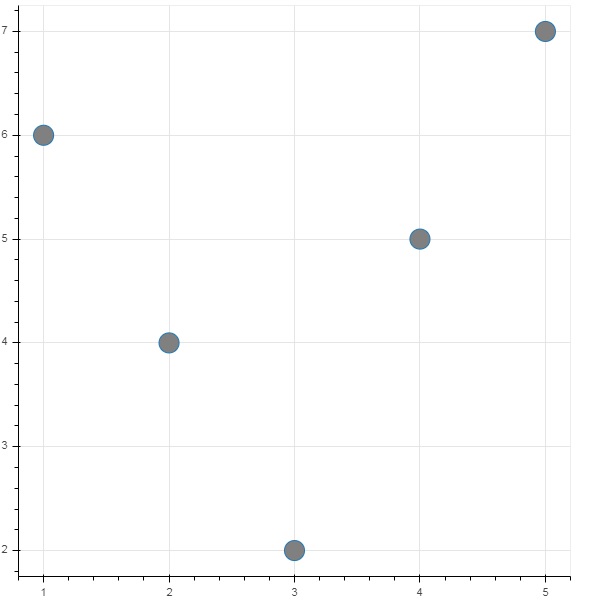
以下 Python 代码生成带有圆圈标记的散点图。
from bokeh.plotting import figure, output_file, show
fig = figure()
fig.scatter([1, 4, 3, 2, 5], [6, 5, 2, 4, 7], marker = "circle", size = 20, fill_color = "grey")
output_file('scatter.html')
show(fig)
输出